On Layout & Web Performance
Outside of initial page load problems, “layout thrashing” is the most common performance problem I see in dynamic web applications. This is particularly true for Single Page Applications which build and destroy views on the fly. However, I’m often amazed by the number of web developers I run into who are unaware of the patterns that cause browsers to do unnecessary layout (aka “reflow” in the Mozilla community). And if you develop using a WebKit browser, there are plenty of tools available that will point out these problems.
Computing and invalidating layout
Like almost every other UI toolkit, your web browser has a notion of automatic layout where it takes the elements in a page adds the CSS styles and figures out where on the screen each element should appear. This can be an expensive process and, for obvious reasons, the expense grows proportional to the number of elements in a page. The part that gets developers in trouble is that web browsers use an on-demand model for layout. It avoids calculating the layout of a page until it really needs to know where on the screen something will appear. This, however, interacts with the DOM APIs in surprising ways. Consider this code:
Accessing offsetHeight is one those parts of the DOM API that requires the browser to have an up-to-date layout. It is important to realize that changing styles can invalidate all the work you just did so that asking for offsetHeight a second time requires another layout to be run. There are times when this is your intent, but far more often the second layout is completely wasted work. Compare, for instance, this similar snippet:
Because of this behavior, it is important for complex web applications to be mindful of when they are measuring (computing) and updating (invalidating) layout. In my simple examples it is very easy to spot the issue, but when a UI is built properly with decoupled components this can be a much more difficult task. Proper encapsulation of UI components actually tends to make debugging these issues even harder as each widget tends to take care of measuring the things it needs on construction to minimize the degree to which their abstractions leak.
Identifying layout problems
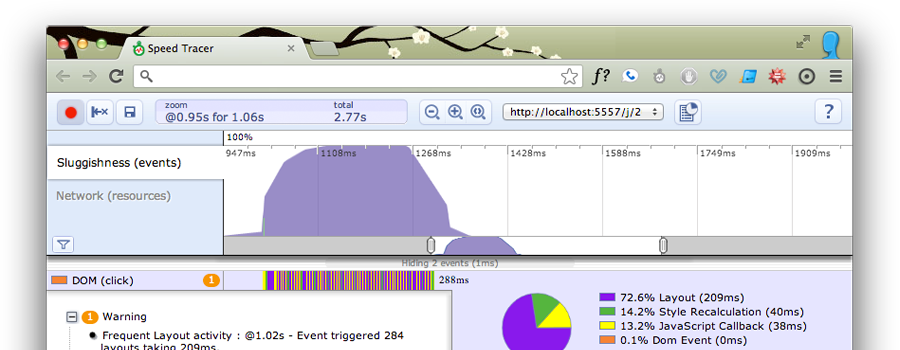
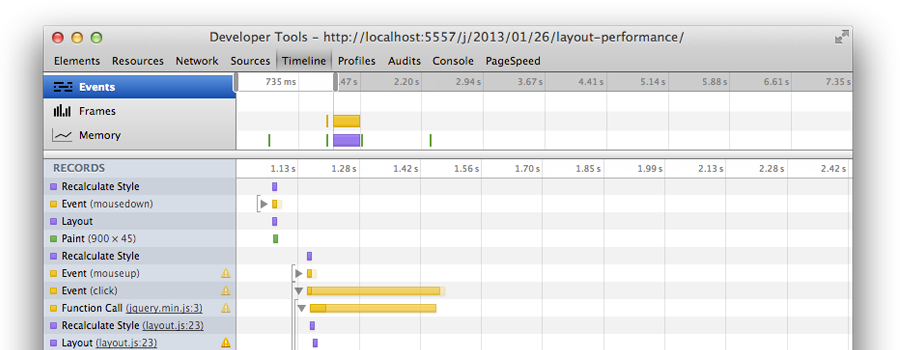
There was a time when finding these issues was very difficult. I once kept instrumented builds of all open source browsers and had a set of massive hacks for IE (that included preamble patching of native code). The situation in Chrome though has gotten a lot better. Fortunately, fixing layout issues in Chrome also tends to carry over to other browsers. My tool of choice for doing this is Speed Tracer. I’m biased, though, because I built it (with a lot of help, of course). There is also a panel built directly into Chrome’s Dev Tools called Timeline. The tracing data you find in Timeline and Speed Tracer is nearly identical since Timeline is actually built on the instrumentation we added for Speed Tracer. I still find Speed Tracer’s presentation of the data a lot more intuitive but, again, I did design most of it. If you can find your way around the Timeline Panel, it does have the benefit of being actively developed and gets regular feature updates. They recently added a Frame Mode, for instance, that organizes the timing data on a frame-by-frame basis.
For instance...
It would be silly of me to talk about this problem without presenting an example. I have embedded a simple graph below and added two buttons that update some elements in that graph. The first uses a strategy that suffers from layout thrashing. The second does not. I will skip the detailed analysis in an effort to encourage you to try the tools I mentioned above. However, the code simply embeds the two patterns I described earlier.
Using Chrome on my own laptop, the first strategy takes about 250ms and the second only about 15ms. That is a pretty large difference given the two behave identically. As apps grow larger with more DOM elements and more styles applied to those elements, the issue worsens. I have actually seen very large apps taking seconds to do seemingly trivial updates due to layout thrashing.
What causes the browser to layout?
When developers realize this problem exists, they rightly want to know all the properties and functions in the DOM APIs that can cause layout. There are a quite a few. I assembled a list in 2010 for WebKit, which I have included below. A harder question to answer, however, is what changes in an element's style cause its layout to be invalidated. Answering that one often requires trial, error and good tools like the two I mentioned earlier.
- clientHeight
- clientLeft
- clientTop
- clientWidth
- focus
- getBoundingClientRect
- getClientRects
- innerText
- offsetHeight
- offsetLeft
- offsetParent
- offsetTop
- offsetWidth
- outerText
- scrollByLines
- scrollByPages
- scrollHeight
- scrollIntoView
- scrollIntoViewIfNeeded
- scrollLeft
- scrollTop
- scrollWidth
- layerX
- layerY
- offsetX
- offsetY
- getComputedStyle
- scrollBy
- scrollTo
- scrollX
- scrollY
- height
- width
Keep in mind that I only list HTML-related objects. I have intentionally ignored WebKit prefixed APIs and SVG objects, but many of those can cause layout as well. One surprising entry is Element.innerText. Maybe I can explain that one in another post.
[Update: innerText vs textContent]